Graphs
- There are many different types of graphs. Often graphs are called charts.
- A graph may be used to summarize, visualize or convey information, mathematical
properties and concepts
- Graphs make it easier to understand large amounts of data and data for one
item is related to other parts of the data..
- Graphs are found in many places where data needs to be explained.
How to Create a Graph
- Graphs can be constructed by hand or by using a computer.
- Create a data table with the type in one column and the associated values in other columns.
- Determine the type of graph you need to make.
- Create the graph by hand or use a computer application to create the graph.
- Most spreadsheets are able to create graphs.
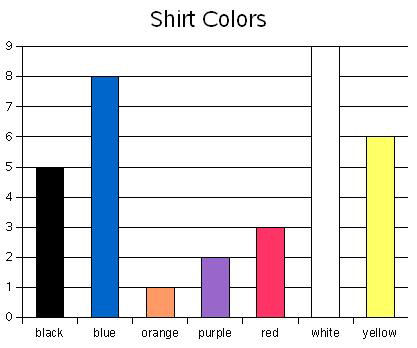
Bar Graph Example
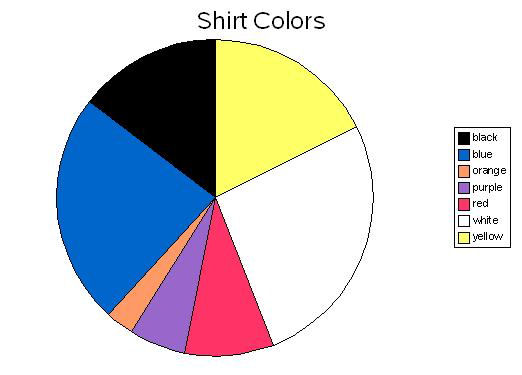
Circle Graph Example
|